Related page: “Projecting the Winner of the 2016 Presidential Election: The Personal Electability Index” » http://personality-politics.org/projecting-the-winner-of-the-2016-presidential-election-the-personal-electability-index

Former Vice President Joe Biden, Sen. Bernie Sanders, and Sen. Kamala Harris at the first Democratic presidential debate, Miami, Florida, June 27, 2019. (Photo: Drew Angerer / Getty Images)
Projecting the Winner of the 2020 Presidential Election: The Personal Electability Index
July 8, 2019

Research conducted at the Unit for the Study of Personality in Politics under the direction of Aubrey Immelman, Ph.D., is projecting the winner of the 2020 U.S. presidential election.
The Personal Electability Index (PEI) developed at the unit projects that none of the seven Democratic contenders assessed by the USPP will be able to defeat Donald Trump.
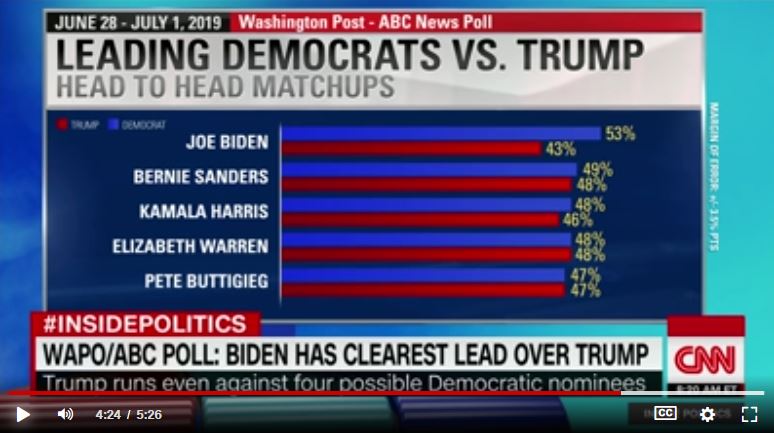
This election-outcome forecast is at variance with a contemporaneous ABC News/Washington Post poll, conducted June 28-July 1, 2019, that shows Trump losing against or statistically tied with the five Democratic front-runners:
Among all adults …, Joe Biden leads Trump by 14 points. But that narrows among the other four Democrats tested against Trump in this poll – an 8-point lead for Kamala Harris, a slight 7 points for Elizabeth Warren, 6 for Bernie Sanders and 4 for Pete Buttigieg. The latter two don’t reach statistical significance.
Among registered voters, moreover, Biden still leads, by 10 points, but the other races all tighten to virtual or actual dead heats – Trump a non-significant -2 points against Harris, -1 against Sanders and exactly tied with Warren and Buttigieg.
The PEI (derived from Millon Inventory of Diagnostic Criteria scale scores) has accurately predicted, before Super Tuesday, the outcome of every presidential election since 1996.
The PEI heuristic model employs candidate personality traits, as publicly perceived, to predict which contender will resonate most favorably with independent and unaffiliated voters who base their voting choice primarily on the candidate’s personal qualities as publicly displayed rather than on party-political affiliation or allegiance.
The PEI model’s predictive utility in recent presidential election cycles appears to derive from the practically even division of the nation into reliably Republican and Democratic voting blocks, essentially yielding the balance of power to politically independent and unaffiliated voters comprising as much as one-third of the electorate.
Research on the psychology of politics conducted at the USPP reveals that voters respond favorably to candidates who are outgoing (extraverted), self-confident (productively narcissistic), and dominant; and negatively to candidates who are introverted and overly conscientious.
First, extraversion (Scale 3: Outgoing) conveys energy, drive, and charisma; the candidate passes the so-called “beer test.”
Second, self-confident, adaptive narcissism (Scale 2: Ambitious) is publicly perceived as leadership competency; legitimately or not, confidence conveys competence.
Third, social dominance (Scale 1A: Dominant) is publicly perceived as signifying strong leadership; governing requires cooperation and compromise, but campaigns reward fighters.
Fourth, introversion (Scale 8: Retiring) conveys low energy, a lack of drive, and the absence of charisma; the candidate fails the “beer test.”
Fifth, although associated with positive traits such as honesty, trustworthiness, integrity, morality, prudence, and competence, conscientiousness (Scale 6: Conscientious) at elevated levels is negatively perceived as being overly programmed, moralistic, officious, and high-handed, which doesn’t play well in retail politics.
As conceptualized by the PEI forecasting model, candidates studied in the 2020 presidential election cycle rank as follows in terms of predicted political impact as a general election candidate:
 Donald Trump
Presidential Electability Index
Range: 65-77 (71 ±6); dysfunctionality adjusted = 45
 Joe Biden
Presidential Electability Index
Range: 16-29 (22.5 ±6.5) / Revised Dec. 2019: 22-33 (27.5 ±5.5)
 Hillary Clinton (Undeclared)
Presidential Electability Index
Score: 27; dysfunctionality adjusted = 12
 Kamala Harris
Presidential Electability Index
Range: 13-27 (20 ±7)
 Bernie Sanders
Presidential Electability Index
Range: 16-23 (19.5 ±3.5)
 Amy Klobuchar
Presidential Electability Index
Range: 13-23 (18 ±5)
 Beto O’Rourke
Presidential Electability Index
Range: 11-23 (17 ±6)
 Pete Buttigieg
Presidential Electability Index
Range: 10-18 (14 ±4)
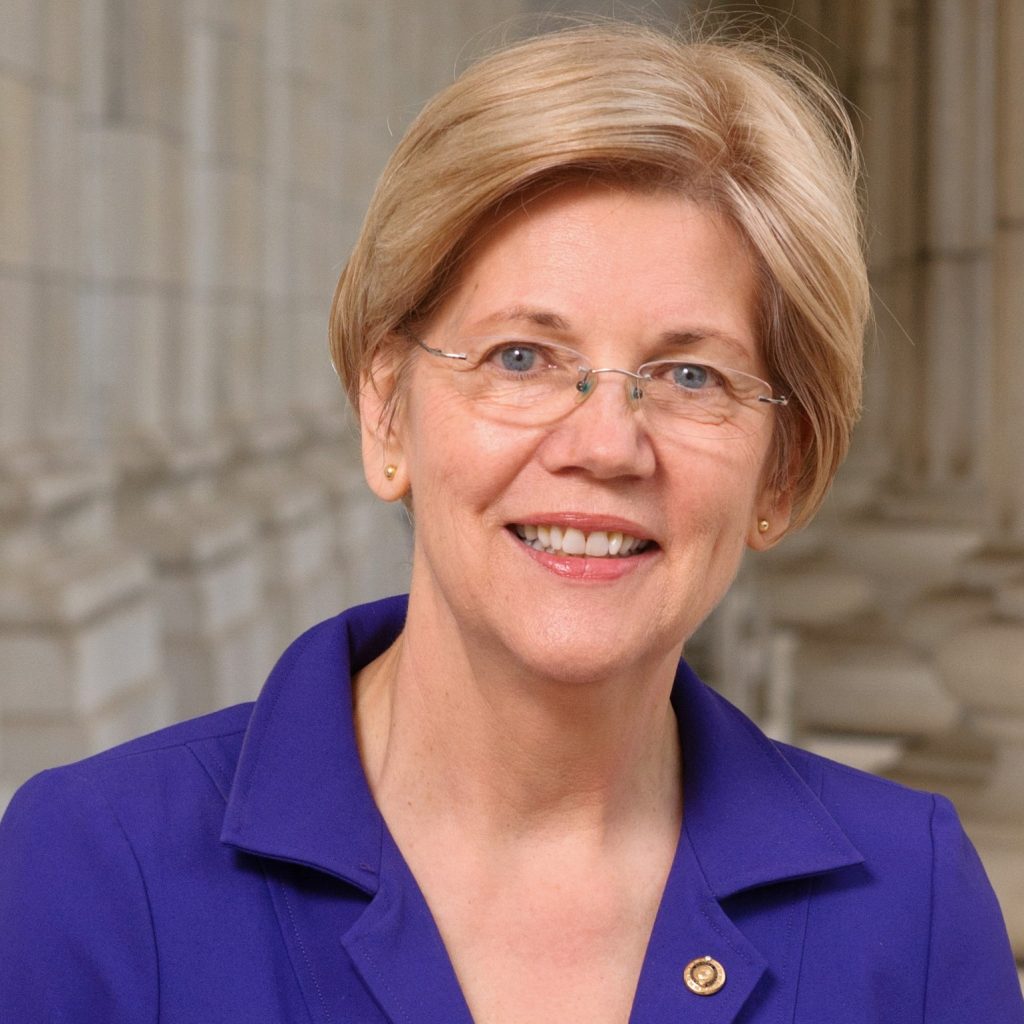 Elizabeth Warren
Presidential Electability Index
Range: 6-8 (7 ±1)
(Scroll down to “Detailed Personal Electability Index scores” for full data analytics)
The Unit for the Study of Personality in Politics’s PEI projection is congruent with the ABC News/Washington Post poll’s finding that, among the Democratic primary front-runners, Joe Biden, Bernie Sanders, and Kamala Harris would pose the strongest challenge to Donald Trump in a hypothetical general election matchup.
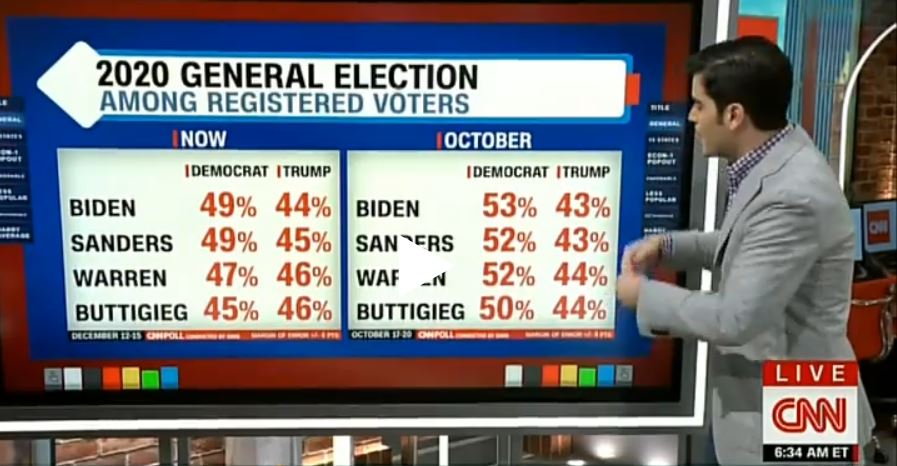
However, as is evident in the CNN screen shot above, the PEI projection that none of the Democratic presidential candidates will be able to defeat Trump in a general election matchup is incongruent with current polling data. Similarly, a recent Fox News poll showed Trump trailing Democratic frontrunners Biden, Sanders, Warren, Harris, and Buttigieg.
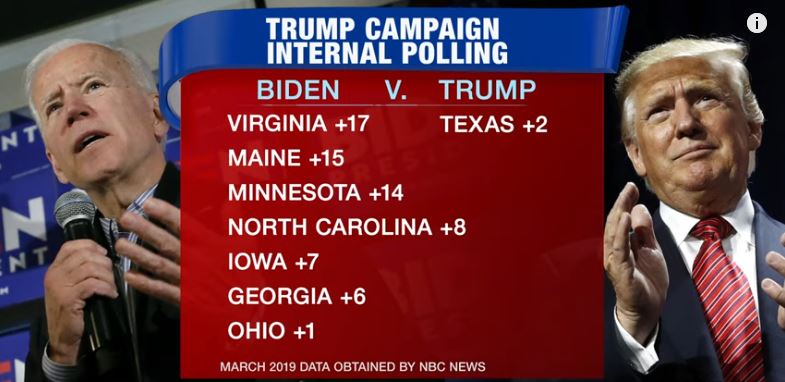
The PEI projection is also inconsistent with Trump’s own internal polling, which shows him losing states he won in 2016 to Biden if the election were held today, including North Carolina, Iowa, Georgia, and Ohio.
Trump maintains advantage in Electoral College (Nov. 4, 2019)
One year from election, Trump trails Biden but leads Warren in battlegrounds (Nate Cohn, The Upshot, New York Times, Nov. 4, 2019) — Despite low national approval ratings and the specter of impeachment, President Trump remains highly competitive in the battleground states likeliest to decide his re-election, according to a set of new surveys from The New York Times Upshot and Siena College. Across the six closest states that went Republican in 2016, he trails Joe Biden by an average of two points among registered voters but stays within the margin of error. Mr. Trump leads Elizabeth Warren by two points among registered voters, the same margin as his win over Hillary Clinton in these states three years ago. … The Times/Siena results and other data suggest that the president’s advantage in the Electoral College relative to the nation as a whole remains intact or has even grown since 2016, raising the possibility that the Republicans could — for the third time in the past six elections — win the presidency while losing the popular vote. …
Joe Biden more electable than Elizabeth Warren (Nov. 9, 2019)
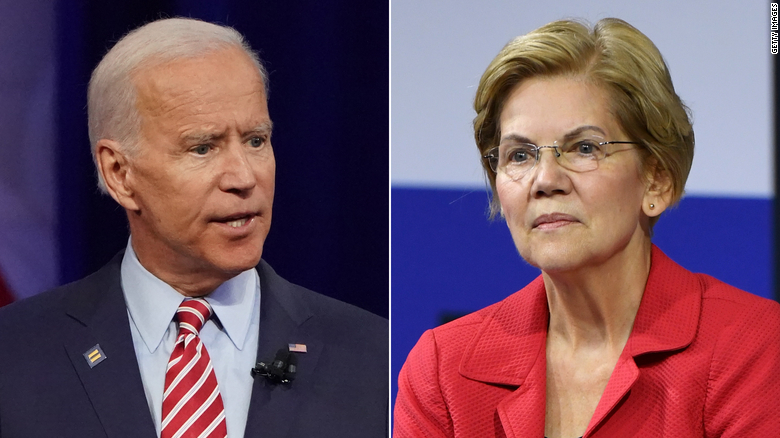
The electability difference between Elizabeth Warren and Joe Biden (Harry Enten, CNN, Nov. 9, 2019) — One consistency in the data … is that Warren runs slightly weaker than Sanders and clearly weaker than Biden. These new polls echo prior data that has shown that Warren’s electability case is not anywhere near as strong as it is for Biden. … The numbers look even worse for Warren among those who aren’t Democrats or Democratic leaning independents. …
Comment
Elizabeth Warren has the lowest PEI score among the seven Democratic contenders studied this election cycle and Joe Biden the highest, suggesting Biden is by far the more viable general election candidate in a matchup against Donald Trump.
Will Democrats pick the right candidate? (Dec. 25, 2019)
The five questions that will decide 2020 election (Julian Zelizer, CNN, Dec. 25, 2019) — Former Vice President Joe Biden…. has argued to Democrats that … he is the only one who can defeat the president in November. … And so far, he has shown that he has considerable appeal. … Biden’s numbers have remained solid despite all the attacks and smears from the administration. Skeptics … must admit he has done better than expected. … Progressives argue that it’s time for a change. The best bet, they say, is someone who can mobilize and inspire voters. …
Comment
Joe Biden has the highest PEI score among the seven Democratic contenders studied this election cycle, suggesting he is the most viable general election candidate in a matchup against Donald Trump; however, his PEI score predicts he is unlikely to defeat President Trump.
CNN poll: Bernie Sanders surges to join Biden atop Democratic presidential pack (Jan. 22, 2020)

Vermont Sen. Bernie Sanders has improved his standing in the national Democratic race for president, joining former Vice President Joe Biden in a two-person top tier above the rest of the field, according to a new CNN poll conducted by SSRS. …
Overall, 27% of registered voters who are Democrats or Democratic-leaning independents back Sanders, while 24% favor Biden. Both … are significantly ahead of the rest of the field, including Massachusetts Sen. Elizabeth Warren at 14% and former South Bend, Indiana, Mayor Pete Buttigieg at 11%. Former New York Mayor Michael Bloomberg lands at 5% in the poll, while Minnesota Sen. Amy Klobuchar and businessman Andrew Yang each hold 4% support. Businessman Tom Steyer has 2%. No other candidate reaches 1% support. …
Comment
The CNN poll is consistent with a contemporaneous SurveyUSA poll, which shows Bernie Sanders marginally outperforming Joe Biden in a head-to-head matchup against Donald Trump if the election were held today:
The poll found that 52 percent of voters would choose Sanders and 43 percent Trump, giving the veteran senator a nine-point lead. Next was former vice president Joe Biden at 50 percent to Trump’s 43 percent, a seven-point lead.
Michael Bloomberg, the media and financial data billionaire, also led Trump by seven points at 49 percent to 42 percent. Democratic Massachusetts Senator Elizabeth Warren leads Trump 48 percent to 45 percent, a three-point advantage.
Pete Buttigieg, the former mayor of South Bend, Indiana, is also ahead of Trump by three points, at 47 percent to 44 percent. The tech entrepreneur Andrew Yang is ahead of Trump by two points, at 46 percent to 44 percent.
The billionaire hedge fund manager Tom Steyer is tied with Trump at 44 percent apiece, Democratic Minnesota Senator Amy Klobuchar loses to Trump by two points at 43 percent to 45 percent.
The CNN and SurveyUSA polls are both at variance with the USPP’s PEI-based election-outcome forecast issued July 8, 2019, which projects Trump will defeat any and all of the seven Democratic contenders studied this election cycle, including Bernie Sanders, Joe Biden, Elizabeth Warren, Pete Buttigieg, and Amy Klobuchar.
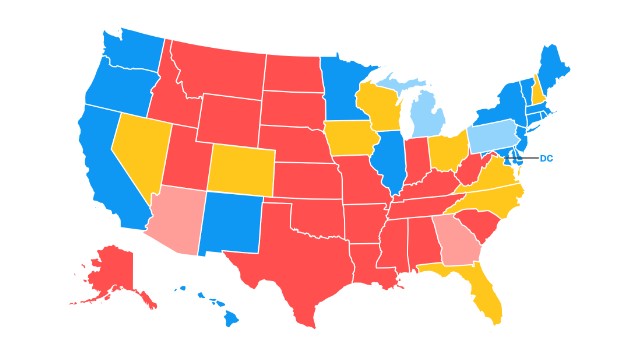
Sabato’s Crystal Ball Electoral College ratings (Feb. 27, 2020)
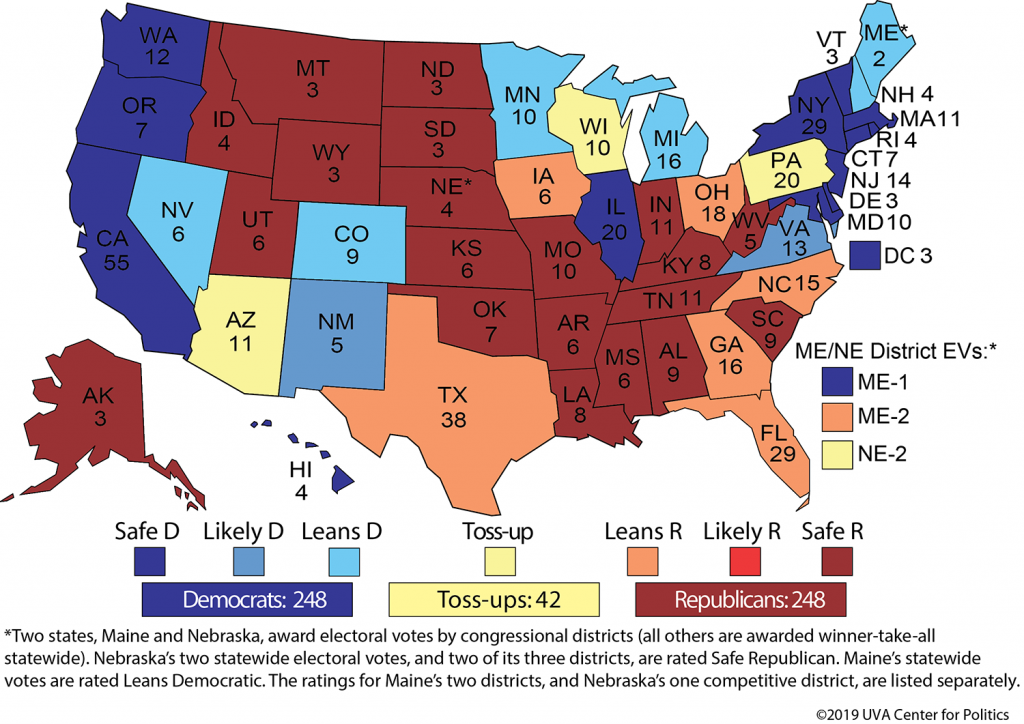
Read analysis by Kyle Kondik and J. Miles Coleman
Biden “Back from the Dead” — Presidential Electability Index Predicted Super Tuesday Election Results (March 4, 2020)
The 2020 U.S. presidential election-outcome forecast issued by the Unit for the Study of Personality in Politics on July 8, 2019, anticipated the surprising Super Tuesday Democratic primary results, with a surging Joe Biden defying polls and political pundits to seize the lead from an ascendant Bernie Sanders in the battle for the Democratic nomination for president.
The Presidential Electability Index (PEI), which has accurately predicted — before Super Tuesday — the outcome of every presidential election since 1996, was developed to forecast general election outcomes; however, the PEI heuristic model (which employs publicly perceived candidate personality traits as the predictor variable) proved to be exceptionally robust in projecting Biden’s unexpected Super Tuesday surge.
As conceptualized by the Personal Electability Index (PEI) forecasting model, Democratic contenders studied in the 2020 presidential election cycle rank as follows in terms of predicted political impact as a general election candidate:
 1. Joe Biden
Presidential Electability Index
Range: 16-29 (22.5 ±6.5) / Revised Dec. 2019: 22-33 (27.5 ±5.5)
 2. Kamala Harris
Presidential Electability Index
Range: 13-27 (20 ±7)
 3. Bernie Sanders
Presidential Electability Index
Range: 16-23 (19.5 ±3.5)
 4. Amy Klobuchar
Presidential Electability Index
Range: 13-23 (18 ±5)
 5. Beto O’Rourke
Presidential Electability Index
Range: 11-23 (17 ±6)
 6. Pete Buttigieg
Presidential Electability Index
Range: 10-18 (14 ±4)
 7. Elizabeth Warren
Presidential Electability Index
Range: 6-8 (7 ±1)
Executive summary
The Unit for the Study of Personality in Politics’ PEI model ranks Biden as more competitive than Sanders in a hypothetical general election matchup against Donald Trump.
Evidently — as suggested by the Super Tuesday Democratic primary results — Biden’s personal characteristics also had a stronger impact on Democratic primary voters than did Sanders’.
Topical research reports
The Political Personality of Former U.S. Vice President Joe Biden. Working paper, Unit for the Study of Personality in Politics, St. John’s University/College of St. Benedict, December 2019. Abstract and link for full-text (21 pages; PDF) download at Digital Commons: http://digitalcommons.csbsju.edu/psychology_pubs/122/
The Political Personality of 2020 Democratic Presidential Contender Bernie Sanders. Working paper, Unit for the Study of Personality in Politics, St. John’s University/College of St. Benedict, March 2020. Abstract and link for full-text (24 pages; PDF) download at Digital Commons: https://digitalcommons.csbsju.edu/psychology_pubs/126/
Stu Rothenberg says Biden now has the edge over Trump in the presidential race (March 18, 2020)

The likely nomination of former Vice President Joe Biden has shifted the race in Democrats’ favor, Stu Rothenberg writes. (Photo: Caroline Brehman / CQ Roll Call)
Presidential race now leans toward the Democrats; Democrats’ coalescing around Biden shifts race away from Trump (Stuart Rothenberg, Roll Call, March 18, 2020) — More than 14 months ago, I wrote a column … suggesting that the 2020 presidential contest was a toss-up, but one that tilted toward the Democrats. I offered caveats about the economy and the Democratic nomination, acknowledging that there was “no way of knowing what events will draw America’s attention 18 or 20 months from now.” Now, the landscape has changed. Democrats are likely to be united in the fall, and President Donald Trump’s standing is stuck where it has been for many months. There are also more questions about presidential leadership and the economy, which the president has been relying on to help him win a second term. The president is an underdog now in his bid for a second term. … The Democratic nominee — Joe Biden — now deserves to be a clear favorite in November’s presidential contest.

Why Joe Biden starts as the 2020 front-runner
April 8, 2020

Democratic presidential candidate Joe Biden speaks during a rally at Tougaloo College in Tougaloo, Mississippi on March 8, 2020. (Photo: Mandel Ngan / AFP via Getty Images)
With Vermont Sen. Bernie Sanders’ decision to end his campaign on Wednesday, it’s now official: Former Vice President Joe Biden will be the Democratic presidential nominee this fall.
And Biden starts the general election against President Donald Trump as the front-runner — albeit not a huge one.
Start with polling. A new Quinnipiac University national poll released Wednesday afternoon put Biden at 49% to Trump’s 41%.
That’s broadly consistent with the Real Clear Politics average of all general election matchups between the two; RCP shows Biden with an average of a 6-point lead over Sanders.
But the presidential election is’t a national popular vote, you will say. And remember what happened in 2016, you will note.
True! But neutral political handicappers also give Biden a small but discernible edge over Trump in the race to 270 electoral votes.
As the Cook Political Report’s Amy Walter wrote in late March:
“Biden starts with a slight lead in the Electoral College math. Right now, 232 electoral votes sit in Lean/Likely or Solid Democrat. On the GOP side, 204 electoral votes are in the Lean/Likely/Solid Republican column. There are six states (and one congressional district) in Toss-Up: Arizona, Florida, North Carolina, Pennsylvania, Michigan, Wisconsin and Nebraska’s 2nd district. Those add up to 102 Electoral votes.”
Around that same time, Stu Rothenberg, founder of the Rothenberg Political Report, concluded much the same thing as he wrote:
“The President is an underdog now in his bid for a second term. That doesn’t mean he can’t win. It simply means that he is in a more difficult place than he was before, in part because Democrats have united behind a consensus candidate who has potentially broad appeal.”
As Rothenberg rightly notes, things change! Four years ago, polls and Electoral College handicapping would have suggested Hillary Clinton was a clear favorite — and we know how that turned out.
But that’s in the fuzzy future. And we are very much in the present right now.
The Point: If today is rightly understood as the first day of the 2020 general election, then as of day one, Joe Biden is more likely to be elected president on November 3 than Donald Trump.
— Chris
Trump campaign demands CNN apologize for poll that shows Biden leading (June 10, 2020)
A new CNN Poll conducted by SSRS finds President Donald Trump’s approval rating down 7 points in the last month as the President falls further behind presumptive Democratic nominee Joe Biden, whose support now stands at its highest level in CNN polling. (3:58)
President Donald Trump’s campaign is demanding CNN retract and apologize for a recent poll that showed him well behind presumptive Democratic presidential nominee Joe Biden. …
The CNN poll conducted by SSRS and released on Monday shows Trump trailing the former vice president by 14 points, 55%-41%, among registered voters. It also finds the President’s approval rating at 38% — his worst mark since January 2019, and roughly on par with approval ratings for one-term Presidents Jimmy Carter and George H.W. Bush at this point in their reelection years — and his disapproval rating at 57%.

The electoral map just keeps getting worse for Trump
June 23, 2020
It’s easy to get lost in the sea of national polls — all of which show former Vice President Joe Biden with high-single digit lead over President Donald Trump.
But as we learned in 2016 (and 2000!), the only count that really matters is the Electoral College.
Unfortunately for Trump, his chances of getting to the 270 electoral votes he needs to win a second term are looking, at least the moment, quite dim.
Over the past week, two major political prognosticators — Amy Walter at the Cook Political Report and Nate Silver of 538 — have released updated looks at the electoral map. And the picture they paint for Trump is dire.
“With just under five months until the election, President Trump is a severe underdog for re-election,” writes Walter, who puts 248 electoral votes solidly or leaning to Biden and 204 solidly or leaning to Trump.
“To win the Electoral College, Biden would need to win just 26 percent of those Toss Up states/districts, while Trump would need to win over 75 percent of them. In other words, Trump has little room for error, while Biden has a wider path to winning.”
Silver’s analysis is similar.
“Overall — assuming that states that haven’t been polled go the same way as they did in 2016 — Biden leads in states worth 368 electoral votes, while Trump leads in states totaling 170 electoral votes,” he writes.
To be clear: Neither Walter nor Silver (nor me) say the election is over or that Trump can’t win. In fact, while Silver suggests there’s a possibility that Biden could win in a “landslide” if all the current toss-up states go to him, “so is a Trump Electoral College victory, depending on which way the race moves between now and November.”
But what they are saying is that right now the electoral map is very much in Biden’s favor. Not only are traditional Democratic states that Trump won in 2016 like Michigan and Pennsylvania looking likely to return to the Democratic column in 2020, but former Republican strongholds like Arizona, North Carolina and maybe even Texas appear to genuinely in play for Biden.
All of which gives the presumptive Democratic nominee, as Walter rightly notes, more paths to the 270 electoral votes he needed to be the 46th president.
Paths do still exist for Trump — most notably by holding two of the three Rust Belt states (Pennsylvania, Michigan and Wisconsin) and keeping the status quo elsewhere on the map.
But there are a whole lot less paths for Trump than for Biden. And with each passing week of late, the number of good electoral map options for Trump just keeps shrinking.
The Point: The best news for Trump is that Election Day is still a ways away. If the election were held today, he would lose convincingly — in the popular vote and the Electoral College.
— Chris
He predicted Trump’s win in 2016. Now he’s ready to call 2020.
Featuring Allan Lichtman![]()
August 5, 2020
Most historians just study the past. But Allan Lichtman has successfully predicted the future. (Video by Nayeema Raza and Kristopher Knight/ The New York Times)
Right now, polls say Joe Biden has a healthy lead over President Trump. But we’ve been here before (cue 2016), and the polls were, frankly, wrong. One man, however, was not. The historian Allan Lichtman was the lonely forecaster who predicted Mr. Trump’s victory in 2016 — and also prophesied the president would be impeached. That’s two for two. But Professor Lichtman’s record goes much deeper. In 1980, he developed a presidential prediction model that retrospectively accounted for 120 years of U.S. election history. Over the past four decades, his system has accurately called presidential victors, from Ronald Reagan in ’84 to, well, Mr. Trump in 2016.
In the video Op-Ed above, Professor Lichtman walks us through his system, which identifies 13 “keys” to winning the White House. Each key is a binary statement: true or false. And if six or more keys are false, the party in the White House is on its way out.
So what do the keys predict for 2020? To learn that, you’ll have to watch the video.
Allan Lichtman (@AllanLichtman) is a professor of history at American University.
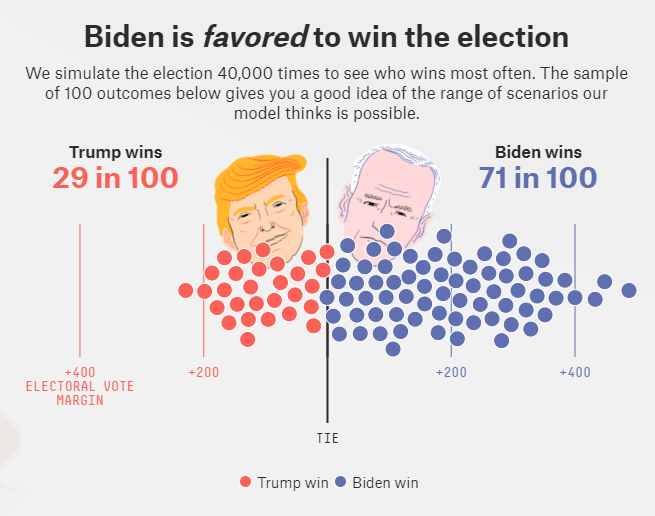
Biden is favored to win the election
August 12, 2020
The presidential race is in many ways just getting started. On Tuesday, we got Joe Biden’s VP pick (Sen. Kamala Harris), the Democratic National Convention is next week, and the Republican National Convention soon after. So while it’s clear that Biden is comfortably ahead of Trump right now — nationally and in most battleground states — the forecast shows Trump with a meaningful chance of winning because there’s still plenty of time for the race to tighten.

September 30, 2020 | by Chris Cillizza and Lauren Dezenski
*Every* model shows Trump has almost no chance
If the 2020 election happened today, President Donald Trump would have, at best, a 1 in 5 chance of beating former Vice President Joe Biden, according to the three major models predicting the outcome.
That 21% chance of a Trump victory comes from 538’s election model, which simulates the election 40,000 times and produces an aggregate of likeliest outcomes based on a variety of factors including historic results, polling and a variety of other variables.
The other two election models most politicos keep tabs on suggest the incumbent has an even smaller chance of winning. The Decision Desk HQ model gives Trump a 17.8% chance of securing a second term in 34 days’ time. The Economist model gives Trump a meager 13% chance of winning.
Which is pretty stunning stuff! And honestly, it would be getting lots more attention if 2016 hadn’t happened. After all, modelers — especially 538’s Nate Silver — became hot commodities after the 2008 election, in which they accurately predicted Barack Obama’s convincing win over John McCain. And Silver proved himself again by nailing the results in all 50 states in 2012. But 2016 did happen. And the models were wrong.
On November 8, 2016 (Election Day), the 538 model gave Trump a 28.4% chance of winning. The New York Times “Upshot” model pegged his chances at 15%. The Huffington Post model gave the billionaire businessman a minuscule 1.7% chance of victory.
What that failure proved is that a model is only as good as the assumptions (and the data behind those assumptions) that you put into it. Trump was able to find voters in three key states — Pennsylvania, Michigan and Wisconsin — who the models missed. So he won.
But simply because election models missed the Trump phenomenon the first time around doesn’t mean we should ignore them entirely. The models are updated to reflect the realignment Trump set in motion in 2016. The likelihood, then, of missing some sort of hidden pro-Trump factors in the electorate is much less.
The Point: In politics, we have a tendency to throw the baby out with the bathwater: The election models missed Trump’s 2016 victory and so, therefore, we should totally ignore what they are saying about 2020. No! Of course the models could be wrong again. But there’s a much higher likelihood that they’re right.
— Chris
Biden is favored to win the election
November 1, 2020
We’re now two days away from Election Day, and Joe Biden leads in both national and state polls. At this point, President Trump needs a big polling error in his favor if he’s going to win — and as editor-in-chief Nate Silver writes, a 2016-sized polling error just isn’t going to cut it 2016-sized polling error just isn’t going to cut it. But that doesn’t mean there isn’t still a path for Trump. Trump might be the underdog, but bigger polling errors have happened in the past, and there’s a difference between a 10 percent chance of winning and a 0 percent chance. A 10 percent chance of winning, which is what our forecast gives Trump, is roughly the same as the odds that it’s raining in downtown Los Angeles. And it does rain there. (Downtown L.A. has about 36 rainy days per year, or about a 1-in-10 shot of a rainy day.)
Anticipating the Outcome of the 2020 Presidential Election: The Final Word
Historian who correctly predicted every election since 1984 makes his call
Fox News, October 30, 2020 — American University Professor Allan Lichtman joins ‘The Story’ to make his prediction on who will win the 2020 presidential election.
By Aubrey Immelman
Unit for the Study of Personality in Politics
November 1, 2020
On July 8, 2019, I announced that the Unit for the Study of Personality in Politics’s Personal Electability Index (PEI) projected that none of the seven front-running Democratic contenders assessed at the USPP — in descending order of PEI scores Joe Biden, Kamala Harris, Bernie Sanders, Amy Klobuchar, Beto O’Rourke, Pete Buttigieg, and Elizabeth Warren — would defeat Donald Trump in the 2020 U.S. presidential election.
At the time, this election-outcome forecast was at variance with contemporaneous polls, for example, an ABC News/Washington Post poll, conducted June 28-July 1, 2019, that showed Trump losing against or statistically tied with the front-runners for the Democratic nomination for president:
Among all adults …, Joe Biden leads Trump by 14 points. But that narrows among the other four Democrats tested against Trump in this poll — an 8-point lead for Kamala Harris, a slight 7 points for Elizabeth Warren, 6 for Bernie Sanders and 4 for Pete Buttigieg.
In the past several months, I have frequently had to field inquiries regarding the status of a projection issued so far in advance of the election — nearly 16 months. For example, on September 29, Cambridge, Mass., psychiatrist John Martin-Joy, M.D., as part of his research for a Psychology Today blog on Joe Biden’s mental state, wrote in an email: “I’m curious if at this point you stand by the PEI’s prediction that Trump will win.”
I responded as follows:
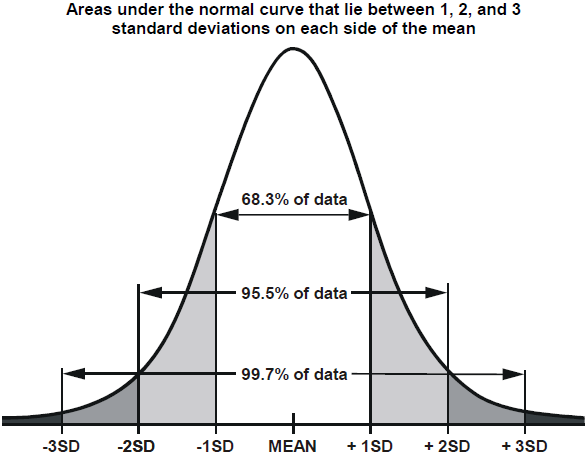
Regarding my simple little PEI heuristic, I have no choice but to “stand by” it; after all, Trump’s personality has not changed significantly since I issued my prediction on July 8, 2019 — nor would one expect it to change at his age, save for organic reasons. … The PEI is blissfully unaware of SARS-CoV-2, the economy, the unemployment numbers, or Trump’s tax returns leaked to the NYT shortly before the election. An implicit assumption of the PEI model is a relatively typical or “normal” election cycle — say (metaphorically) within one standard deviation of the mean. If the PEI projection of a Trump win turns out to be correct, it should be considered strong suggestive evidence for the robustness of the model.
In practical terms, the point I was attempting to communicate to Dr. Martin-Joy was that the 2020 presidential election is taking place under highly unusual circumstances; in fact, some observers have referred to the political environment as “unprecedented.”
In that regard, it should be noted that the PEI heuristic model employs candidate personality traits, as publicly perceived, to predict which contender will resonate most favorably with independent and unaffiliated voters who base their voting choice primarily on the candidate’s personal qualities as publicly displayed rather than on party-political affiliation or allegiance. The implicit assumption is that the election occurs in a relatively typical, stable political environment in which the role of personality is not overwhelmed by strong situational forces (such as a global pandemic, a deep economic recession, high unemployment, social upheaval, or widespread civil unrest).
“Relatively typical” is in the eye of the beholder, but to invoke the normal curve metaphor, typicality can be defined as falling within one standard deviation of the mean (i.e., the general political environment in nearly 7 out of 10 election cycles). Of course, if social and economic circumstances surrounding the current presidential election truly are “unprecedented,” it could even be ventured that the 2020 presidential election is taking place in a political environment fully two standard deviations from the norm (i.e., more unusual than 9 out of 10 presidential election cycles).

Photo credits: Kevin Lamarque and Tom Brenner / Reuters
To conclude, I am not predicting the outcome of the presidential election, in which statistical models infinitely more sophisticated than my simple PEI heuristic give Joe Biden a 9-to-1 edge over Joe Biden. What I am asserting, however, is that — based solely on their respective personality profiles as assessed at the Unit for the Study of Personality in Politics — it’s advantage Donald Trump.
Trump wins title of Americans’ most admired man in annual survey
By Kelly Hooper![]()
December 29, 2020

Eighteen percent of U.S. adults surveyed in Gallup’s annual poll named President Trump when asked which man “living anywhere in the world they admire most.” (Photo: Patrick Semansky / AP via Politico)
President Donald Trump has come out on top as Americans’ most-admired man for 2020, according to Gallup’s annual survey, ending former President Barack Obama’s 12-year run with the title.
This year’s poll results mark the first time Trump has won most-admired man on his own, after last year tying with Obama for the title. …
18 percent of the U.S. adults surveyed named Trump when asked which man “living anywhere in the world they admire most,” while 15 percent named Obama. President-elect Joe Biden was third [at 6 percent]. …
Detailed Personal Electability Index scores
Following are the scores of candidates studied in the 2020 presidential election cycle on the Millon Inventory of Diagnostic Criteria-based Personal Electability Index, which has accurately predicted the outcome of every presidential election since 1996.
Donald Trump: PEI = 65-77 (71 ±6); dysfunctionality adjusted = 45*
| Scale: | 1A | 1B | 2 | 3 | 4 | 5A | 5B | 6 | 7 | 8 |
| Lower bound: | 17 | 9 | 24 | 24 | 0 | 0 | 4 | 0 | 0 | 0 |
| Upper bound: | 20 | 14 | 30 | 27 | 1 | 0 | 9 | 3 | 0 | 1 |
| Adjusted: | 15 | 9 | 15 | 15 | 0 | 0 | 4 | 0 | 0 | 0 |
Lower bound PEI = [Extraversion (scale 3) = 17] + [Narcissism (scale 2) = 24] + [Dominance (scale 1A) = 17] – [Introversion (scale 8) = 0] – [Conscientiousness (scale 6) = 0] = 65 – 0 = 65
Upper bound PEI = [Extraversion (scale 3) = 27] + [Narcissism (scale 2) = 30] + [Dominance (scale 1A) = 20] – [Introversion (scale 8) = 0] – [Conscientiousness (scale 6) = (3 – 3) = 0] = 77 – 0 = 77
Dysfunctionality adjusted PEI = [Extraversion (scale 3) = (24 – 9) = 15] + [Narcissism (scale 2) = (24 – 9) = 15] + [Dominance (scale 1A) = (17 – 2) = 15] – [Introversion (scale 8) = 0] – [Conscientiousness (scale 6) = 0] = 45 – 0 = 45
* The dysfunctionality adjusted score limits positive points for scales 1A, 2, and 3 to 15, based on the assumption that scale elevations above 15 may be dysfunctional in some respects. (Note also that the PEI heuristic specifies that negative points for scale 6 are assigned for scale elevations above 4 only.)
Donald Trump (updated July 8, 2020): PEI = 64-84 (74 ±10); dysfunctionality adjusted = 45*
| Scale: | 1A | 1B | 2 | 3 | 4 | 5A | 5B | 6 | 7 | 8 |
| Lower bound: | 22 | 14 | 22 | 20 | 0 | 0 | 2 | 0 | 0 | 0 |
| Upper bound: | 28 | 22 | 30 | 26 | 1 | 0 | 9 | 3 | 0 | 1 |
| Adjusted: | 15 | 14 | 15 | 15 | 0 | 0 | 2 | 0 | 0 | 0 |
Lower bound PEI = [Extraversion (scale 3) = 20] + [Narcissism (scale 2) = 22] + [Dominance (scale 1A) = 22] – [Introversion (scale 8) = 0] – [Conscientiousness (scale 6) = 0] = 64 – 0 = 64
Upper bound PEI = [Extraversion (scale 3) = 26] + [Narcissism (scale 2) = 30] + [Dominance (scale 1A) = 28] – [Introversion (scale 8) = 0] – [Conscientiousness (scale 6) = (3 – 3) = 0] = 84 – 0 = 84
Dysfunctionality adjusted PEI = [Extraversion (scale 3) = (20 – 5) = 15] + [Narcissism (scale 2) = (22 – 7) = 15] + [Dominance (scale 1A) = (22 – 7) = 15] – [Introversion (scale 8) = 0] – [Conscientiousness (scale 6) = 0] = 45 – 0 = 45
Joe Biden: PEI = 16-29 (22.5 ±6.5)
| Scale: | 1A | 1B | 2 | 3 | 4 | 5A | 5B | 6 | 7 | 8 |
| Lower bound: | 3 | 2 | 4 | 9 | 5 | 0 | 1 | 1 | 0 | 0 |
| Upper bound: | 6 | 4 | 10 | 13 | 5 | 0 | 1 | 4 | 0 | 0 |
Lower bound PEI = [Extraversion (scale 3) = 9] + [Narcissism (scale 2) = 4] + [Dominance (scale 1A) = 3] – [Introversion (scale 8) = 0] – [Conscientiousness (scale 6) = (1 – 1) = 0] = 16 – 0 = 16
Upper bound PEI = [Extraversion (scale 3) = 13] + [Narcissism (scale 2) = 10] + [Dominance (scale 1A) = 6] – [Introversion (scale 8) = 0] – [Conscientiousness (scale 6) = (4 – 4) = 0] = 29 – 0 = 29
Joe Biden (updated Dec. 31, 2019): PEI = 22-33 (27.5 ±5.5)
| Scale: | 1A | 1B | 2 | 3 | 4 | 5A | 5B | 6 | 7 | 8 |
| Lower bound: | 4 | 3 | 5 | 13 | 5 | 0 | 0 | 0 | 0 | 0 |
| Upper bound: | 6 | 4 | 11 | 16 | 5 | 0 | 1 | 3 | 0 | 0 |
Lower bound PEI = [Extraversion (scale 3) = 13] + [Narcissism (scale 2) = 5] + [Dominance (scale 1A) = 4] – [Introversion (scale 8) = 0] – [Conscientiousness (scale 6) = (0 – 0) = 0] = 22 – 0 = 22
Upper bound PEI = [Extraversion (scale 3) = 16] + [Narcissism (scale 2) = 11] + [Dominance (scale 1A) = 6] – [Introversion (scale 8) = 0] – [Conscientiousness (scale 6) = (3 – 3) = 0] = 33 – 0 = 33
Joe Biden (updated Aug. 8, 2020): PEI = 21-33 (27 ±6)
| Scale: | 1A | 1B | 2 | 3 | 4 | 5A | 5B | 6 | 7 | 8 |
| Lower bound: | 3 | 1 | 5 | 13 | 9 | 0 | 0 | 2 | 0 | 0 |
| Upper bound: | 6 | 4 | 8 | 19 | 11 | 1 | 0 | 4 | 0 | 0 |
Lower bound PEI = [Extraversion (scale 3) = 13] + [Narcissism (scale 2) = 5] + [Dominance (scale 1A) = 3] – [Introversion (scale 8) = 0] – [Conscientiousness (scale 6) = (2 – 2) = 0] = 21 – 0 = 21
Upper bound PEI = [Extraversion (scale 3) = 19] + [Narcissism (scale 2) = 8] + [Dominance (scale 1A) = 6] – [Introversion (scale 8) = 0] – [Conscientiousness (scale 6) = (4 – 4) = 0] = 33 – 0 = 33
Hillary Clinton: PEI = 27; dysfunctionality adjusted = 12*
| Scale: | 1A | 1B | 2 | 3 | 4 | 5A | 5B | 6 | 7 | 8 |
| Score: | 21 | 2 | 24 | 0 | 0 | 0 | 3 | 15 | 1 | 7 |
Scale: 1A = 21; 2 = 24; 3 = 0; 6 = 15; 8 = 7
PEI = [Extraversion (scale 3) = 0] + [Narcissism (scale 2) = 24] + [Dominance (scale 1A) = 21] – [Introversion (scale 8) = 7] – [Conscientiousness (scale 6) = (15 – 4) = 11] = 45 – 18 = 27
Dysfunctionality adjusted PEI = [Extraversion (scale 3) = 0] + [Narcissism (scale 2) = (24 – 9) = 15] + [Dominance (scale 1A) = (21 – 6) = 15] – [Introversion (scale 8) = 7] – [Conscientiousness (scale 6) = (15 – 4) = 11] = 30 – 18 = 12
Kamala Harris: PEI = 13-27 (20 ±7)
| Scale: | 1A | 1B | 2 | 3 | 4 | 5A | 5B | 6 | 7 | 8 |
| Lower bound: | 4 | 2 | 4 | 5 | 3 | 1 | 1 | 3 | 0 | 0 |
| Upper bound: | 8 | 4 | 6 | 13 | 4 | 1 | 2 | 4 | 1 | 0 |
Lower bound PEI = [Extraversion (scale 3) = 5] + [Narcissism (scale 2) = 4] + [Dominance (scale 1A) = 4] – [Introversion (scale 8) = 0] – [Conscientiousness (scale 6) = (1-1) = 0] = 13 – 0 = 13
Upper bound PEI = [Extraversion (scale 3) = 13] + [Narcissism (scale 2) = 6] + [Dominance (scale 1A) = 8] – [Introversion (scale 8) = 0] – [Conscientiousness (scale 6) = (4 – 4) = 0] = 27 – 0 = 27
Bernie Sanders: PEI = 16-23 (19.5 ±3.5)
| Scale: | 1A | 1B | 2 | 3 | 4 | 5A | 5B | 6 | 7 | 8 |
| Lower bound: | 9 | 5 | 5 | 3 | 2 | 0 | 4 | 3 | 0 | 1 |
| Upper bound: | 13 | 11 | 9 | 4 | 5 | 1 | 12 | 5 | 0 | 2 |
Lower bound PEI = [Extraversion (scale 3) = 3] + [Narcissism (scale 2) = 5] + [Dominance (scale 1A) = 9] – [Introversion (scale 8) = 1] – [Conscientiousness (scale 6) = (3 – 3) = 0] = 17 – 1 = 16
Upper bound PEI = [Extraversion (scale 3) = 4] + [Narcissism (scale 2) = 9] + [Dominance (scale 1A) = 13] – [Introversion (scale 8) = 2] – [Conscientiousness (scale 6) = (5 – 4) = 1] = 26 – 3 = 23
Amy Klobuchar: PEI = 13-23 (18 ±5)
| Scale: | 1A | 1B | 2 | 3 | 4 | 5A | 5B | 6 | 7 | 8 |
| Lower bound: | 11 | 3 | 7 | 4 | 5 | 0 | 1 | 13 | 0 | 0 |
| Upper bound: | 20 | 3 | 11 | 6 | 5 | 0 | 3 | 17 | 0 | 1 |
Lower bound PEI = [Extraversion (scale 3) = 4] + [Narcissism (scale 2) = 7] + [Dominance (scale 1A) = 11] – [Introversion (scale 8) = 0] – [Conscientiousness (scale 6) = (13 – 4) = 9] = 22 – 9 = 13
Upper bound PEI = [Extraversion (scale 3) = 6] + [Narcissism (scale 2) = 11] + [Dominance (scale 1A) = 20] – [Introversion (scale 8) = 1] – [Conscientiousness (scale 6) = (17 – 4) = 13] = 37 – 14 = 23
Beto O’Rourke: PEI = 11-23 (17 ±6)
| Scale: | 1A | 1B | 2 | 3 | 4 | 5A | 5B | 6 | 7 | 8 |
| Lower bound: | 1 | 5 | 4 | 6 | 5 | 1 | 1 | 1 | 0 | 0 |
| Upper bound: | 3 | 13 | 6 | 14 | 7 | 3 | 3 | 2 | 3 | 0 |
Lower bound PEI = [Extraversion (scale 3) = 6] + [Narcissism (scale 2) = 4] + [Dominance (scale 1A) = 1] – [Introversion (scale 8) = 0] – [Conscientiousness (scale 6) = (1 – 1) = 0] = 11 – 0 = 11
Upper bound PEI = [Extraversion (scale 3) = 14] + [Narcissism (scale 2) = 6] + [Dominance (scale 1A) = 3] – [Introversion (scale 8) = 0] – [Conscientiousness (scale 6) = (2 – 2) = 0] = 23 – 0 = 23
Pete Buttigieg: PEI = 10-18 (14 ±4)
| Scale: | 1A | 1B | 2 | 3 | 4 | 5A | 5B | 6 | 7 | 8 |
| Lower bound: | 2 | 2 | 4 | 4 | 5 | 1 | 0 | 3 | 2 | 0 |
| Upper bound: | 3 | 4 | 9 | 8 | 7 | 2 | 1 | 5 | 4 | 1 |
Lower bound PEI = [Extraversion (scale 3) = 4] + [Narcissism (scale 2) = 4] + [Dominance (scale 1A) = 2] – [Introversion (scale 8) = 0] – [Conscientiousness (scale 6) = (3 – 3) = 0] = 10 – 0 = 10
Upper bound PEI = [Extraversion (scale 3) = 8] + [Narcissism (scale 2) = 9] + [Dominance (scale 1A) = 3] – [Introversion (scale 8) = 1] – [Conscientiousness (scale 6) = (5 – 4) = 1] = 20 – 2 = 18
Elizabeth Warren: PEI = 11-15 (13 ±2)
| Scale: | 1A | 1B | 2 | 3 | 4 | 5A | 5B | 6 | 7 | 8 |
| Lower bound: | 9 | 2 | 4 | 3 | 1 | 0 | 2 | 4 | 3 | 1 |
| Upper bound: | 11 | 3 | 8 | 4 | 4 | 3 | 3 | 12 | 7 | 4 |
Lower bound PEI = [Extraversion (scale 3) = 3] + [Narcissism (scale 2) = 4] + [Dominance (scale 1A) = 9] – [Introversion (scale 8) = 1] – [Conscientiousness (scale 6) = (4 – 4) = 0] = 16 – 1 = 15
Upper bound PEI = [Extraversion (scale 3) = 4] + [Narcissism (scale 2) = 8] + [Dominance (scale 1A) = 11] – [Introversion (scale 8) = 4] – [Conscientiousness (scale 6) = (12 – 4) = 8] = 23 – 12 = 11
Elizabeth Warren (updated Sept. 25, 2019): PEI = 6-8 (7 ±1)
| Scale: | 1A | 1B | 2 | 3 | 4 | 5A | 5B | 6 | 7 | 8 |
| Lower bound: | 8 | 0 | 4 | 1 | 0 | 1 | 2 | 9 | 2 | 2 |
| Upper bound: | 11 | 2 | 6 | 2 | 1 | 1 | 3 | 12 | 4 | 3 |
Lower bound PEI = [Extraversion (scale 3) = 1] + [Narcissism (scale 2) = 4] + [Dominance (scale 1A) = 8] – [Introversion (scale 8) = 2] – [Conscientiousness (scale 6) = (9 – 4) = 5] = 13 – 7 = 6
Upper bound PEI = [Extraversion (scale 3) = 2] + [Narcissism (scale 2) = 6] + [Dominance (scale 1A) = 11] – [Introversion (scale 8) = 3] – [Conscientiousness (scale 6) = (12 – 4) = 8] = 19 – 11 = 8
PEI Scores for Democratic and Republican Nominees, 1996-2020
For historical context, here are the personality-based electability scores for all major-party nominees since 1996, published before Super Tuesday in presidential election years, with the successful candidate listed first:
- 1996: Bill Clinton 37, Bob Dole 15
- 2000: George W. Bush 31, Al Gore -17
- 2004: George W. Bush 31, John Kerry 9
- 2008: Barack Obama 28, John McCain 26
- 2012: Barack Obama 10, Mitt Romney 6
- 2016: Donald Trump 62 (45 adjusted), Hillary Clinton 39 (29 adjusted)
- 2020: Donald Trump 63-84 (45 adjusted), Joe Biden 21-33
Related report
Projecting the Winner of the 2016 Presidential Election: The Personal Electability Index (Feb. 29, 2016)








Follow Aubrey Immelman